The source of the data
Every dataset comes from data.gov.ro, the place to go if you want to find all sorts of government datasets. Everything from hospital expenditures to how much the Ministry of Justice has spent on furniture can be found here.
Maybe my perception is skewed but I can’t help but feel like everything on this website is published as a legal requirement. Especially since a lot of the data is unusable, the rating system I think might be wrong or botted or both and the sorting doesn't work properly for anything but names.
All of this prompted me to gain interest in working with some data from this website. More as a proof of concept for myself, and maybe to inspire others to look into what lies published and forgotten. I tried to do a project about the unemployment data that gets published monthly by the National Agency for Employment.
Early compromises
Deciding not to scrape a government website I cornered myself into downloading the files by hand which is the biggest flaw of this project. Since naming conventions weren't used at all until recently I also had to rename almost every dataset

Renaming the files
To rename the files we use the os library to parse through the files and use the roots of the words to rename each file accordingly. Thankfully most of the files had some common sequence of letters I can use as guidelines while renaming.
            import os
            file_path = r'\\analysis\\renamed\\'
            for folder, sub_folders, files in os.walk(file_path):
                print(f'Currently lookin at {folder}')
                print('\n')
                print('The subfolders are: ')
                for sub_fold in sub_folders:
                    print(f'\t Subfolder: {sub_fold}')
                print('\n')
                print(f'The files are: {files}')
                print('\n')

                for f in files:
                    print(f'\t File: {f}')
                    if 'medi' in f:
                        os.rename(folder+'\\'+f, folder+'\\'+'media_'+f)
                    elif 'varst' in f:
                        os.rename(folder+'\\'+f, folder+'\\'+'various_'+f)
                    elif 'rata' in f:
                        os.rename(folder+'\\'+f, folder+'\\'+'rate_'+f)
                    elif 'educat' in f or 'studii' in f:
                        os.rename(folder+'\\'+f, folder+'\\'+'education_'+f)
                    print('\n')
                    print(f'\t File: {f}')
                print('\n')
                print(f' I exit here ')
                print('\n')
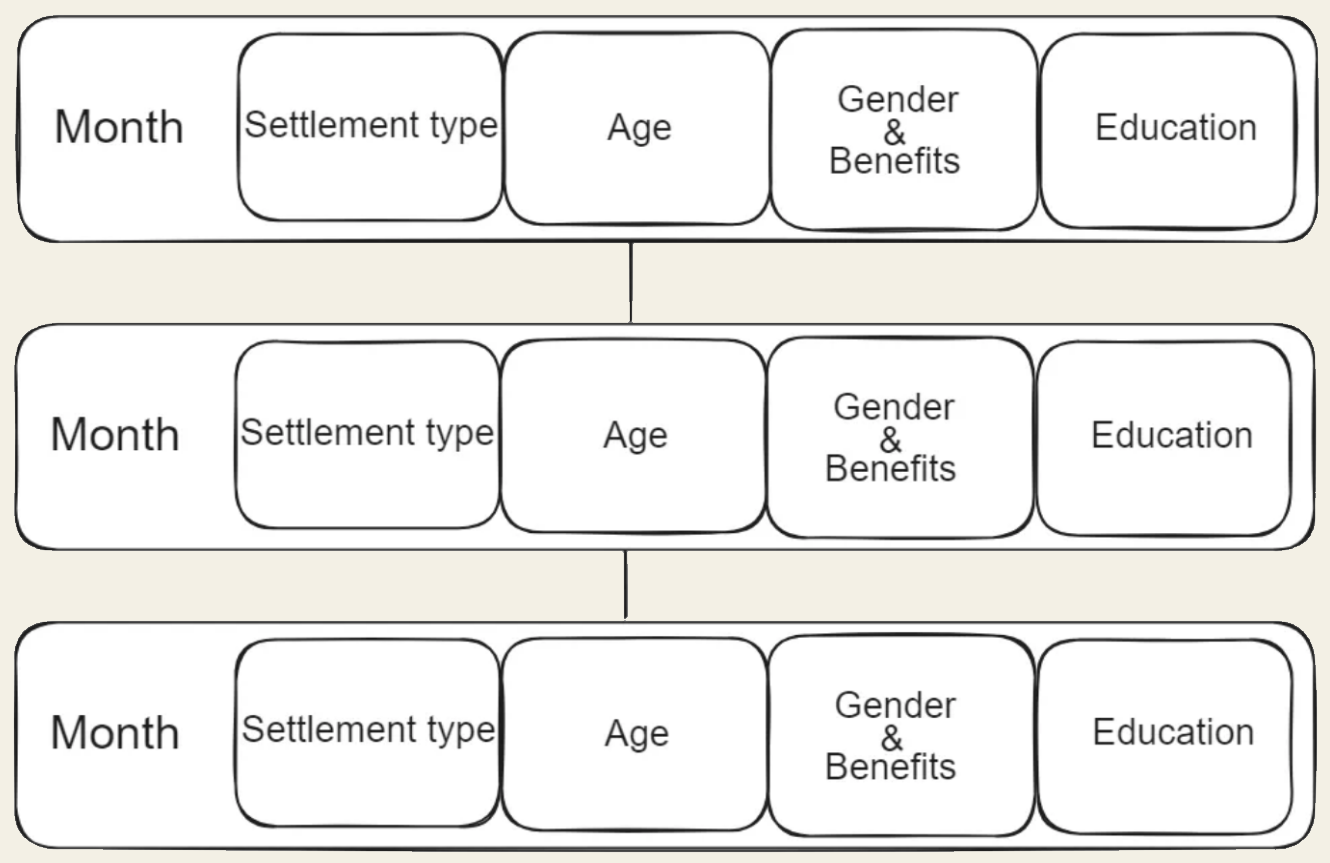
Checking everything is alright before we start to join horizontally
We parse with the os library once more. Since all the file names have now been changed, the order within each folder is the same for every month and there is no need to order them ourselves.
        import os
        import pandas as pd
        folder_path= r'\\analysis\\renamed\\'
        base = pd.DataFrame()
        for folder , sub_folders, files in os.walk(folder_path):
            print(f'Currently lookin at {folder}')
            print('\n')
            print('The subfolders are: ')
            for sub_fold in sub_folders:
                print(f'\t Subfolder: {sub_fold}')

            print('\n')
            print('The files are: ')
Joining and Cleaning

We join horizontally the four datasets from each month while removing diacritics, and deleting empty rows or columns which might appear from reading so many CSV files. Considering that many print and if statements are used, this practice proved extremely useful while debugging. Each file required me to check for discrepancies in column count and column names just in case the data provided had duplicate names or other mishaps.
        csv_files = [f for f in files if f.endswith('.csv')]
        df_list = []
        for csv in csv_files:
            file_path = os.path.join(folder, csv)
            df = pd.read_csv(file_path, encoding='ISO-8859-1')

            df=df[:42]

            df.rename(columns=lambda x: x.replace(" ", "")
                              .replace('.','').replace('?','').replace("-", "")
                              .replace("Ă", "A").replace("Ţ", "T").replace("Ă", "A")
                              .replace("Ş", "S").replace("Â", "a").replace("Î", "I")
                              .replace(',','').lower(), inplace=True)

            for item in df.columns:
                if 'unnamed' in item:
                    df.drop(item, axis=1,inplace=True)

            year_month = folder.split('\\')[-1]
            df['origin'] = year_month + '-' + csv[:-4]

            df[df.columns[0]]=df[df.columns[0]].apply(lambda s:
                              s.lower().replace('mun.','').replace('.','')
                              .replace('municipiul','').replace('-severin','')
                              .replace(' ','').replace('uresti','')
                              .replace("ă", "a").replace("ț", "t").replace("ș", "s")
                              .replace("â", "a").replace("î", "i").replace('-','')
                              .replace('nasaud','').replace('severin',''))
            print('\n')
            print(f"Before sorting:")
            print(df[df.columns[0]])
            df=df.sort_values(by=df.columns[0], ascending=True )
            df = df.reset_index(drop=True)
            print('\n')
            print(f"After sorting:")
            print(df[df.columns[0]])
            print('\n')
            print(df.columns)
            print('\n')
            print(len(df.columns))
            print('\n')
            df_list.append(df)
Once every month is ready, we join vertically
        if df_list:
            current_month = pd.concat(df_list, axis=1, ignore_index=True)
            current_month = current_month.iloc[:42, :]
            print(len(current_month.columns))
            print('\n')
            if not current_month.empty:
                base = pd.concat([base, current_month], axis=0, ignore_index=True)

        print('\n')
        print(f'\t All the files are {files}')
        print('\n')
        print('\n')
        print(f' I exit here ')
        print('\n')
        base
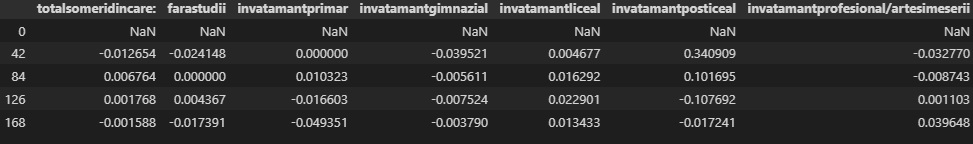
Checking for missing values and wrong data types
Missing data
We use a heatmap that helps us identify which rows and columns are problematic. This is an example of what it would look like if we missed quite a bit of data.

Thankfully we don't have many missing values, and some of them can be explained. For example we can observe that a series of months at the beginning of 2019 had NaN values instead of zeroes due to Bucharest having no rural area.
            import matplotlib.pyplot as plt
            import seaborn as sns
            plt.figure(figsize = (20,40))
            sns.heatmap(base.isnull(), yticklabels=False, cbar=False, cmap='viridis')

You can find which rows and files are faulty using the origin column which is made with the names of the folders and CSVs.
            # the folder names were made to be year-month ( 22-09 )
            year_month = folder.split('\\')[-1]
            # if a path is provided "C:\\path\\to\\folder\\22-09"
            # folder.split('\\')[-1] takes the 22-09 part of the path
            df['origin'] = year_month + '-' + csv[:-4]
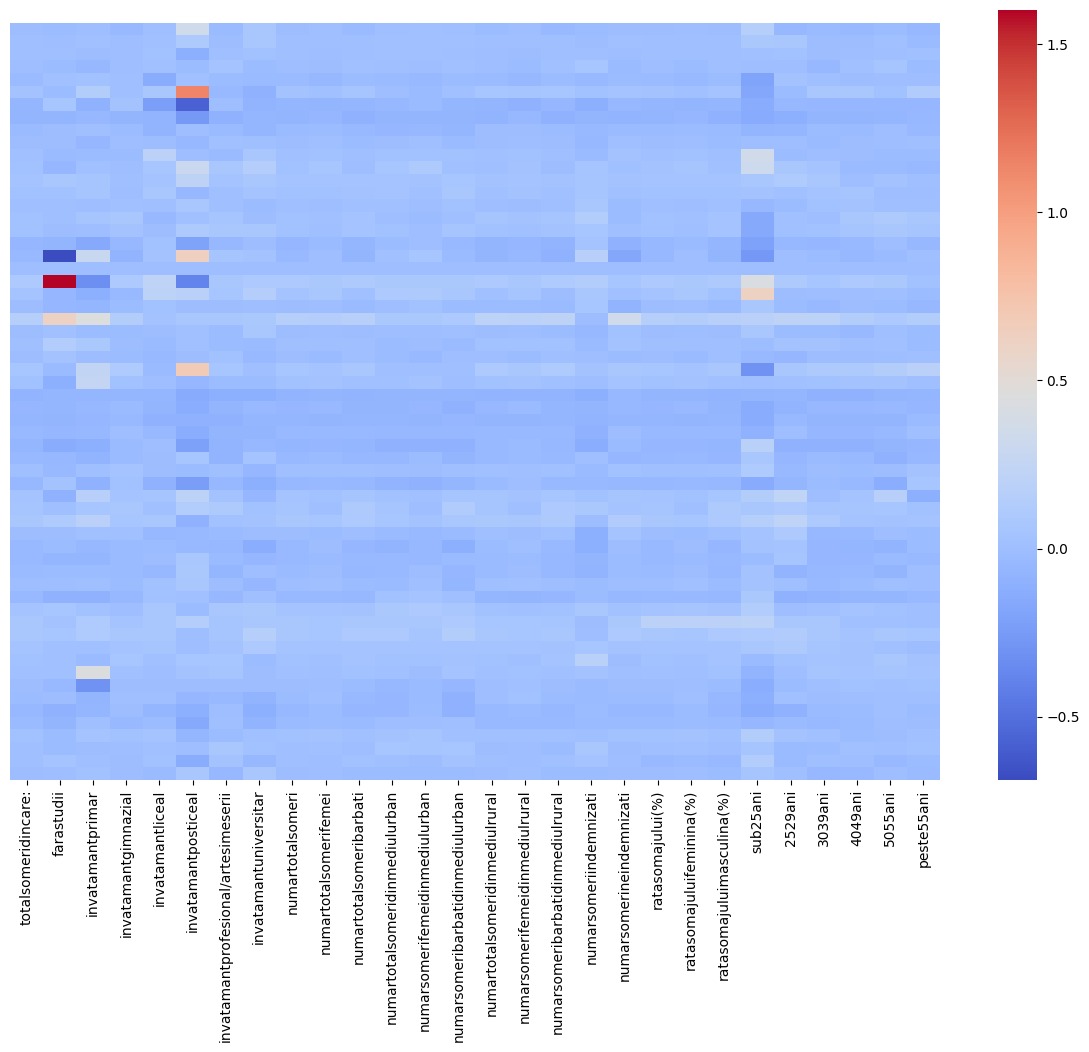
Wrong data types
I utilized a mask dataset where integers, floats, and other data types are represented by ones, twos, and threes respectively.My aim was to generate a data type heatmap for an easier identification of columns modification occurred and to understand the reasons and locations of these alterations.
        mask = base.applymap(lambda x: 2 if isinstance(x, (float, np.floating))
                  else 1 if isinstance(x, (int, np.integer))
                  else 3)
        # 1 for int, 2 for floating, 3 for object
        plt.figure(figsize = (15,20))
        heatmap = sns.heatmap(mask, yticklabels=False, cbar=False, cmap=['#636EFA', '#EF553B', '#FECB52'])
        heatmap.set_title("Data Type Mask Heatmap \n Blue : int \n Red : float \n Yellow : string", fontsize=16)
        plt.show()

I began by removing duplicate columns and then proceeded to assign data types where numerical values were expected. I also converted floating numbers and strings to integers where necessary.
            for item in list_of_numbered_columns:
    switch=0
    for i in range(0, len(base[item])):
        current_type = type(base[item][i])
        if np.issubdtype(current_type, np.float64) and switch==0:
            base[item]=base[item].astype(int)
            switch=1
            current_type = type(base[item][i])
        elif np.issubdtype(current_type, str) and switch==0:
            base[item]=pd.to_numeric(base[item].str.replace(',', ''))
            switch=1
            current_type = type(base[item][i])
        elif not (np.issubdtype(current_type, np.int32) or np.issubdtype(current_type, np.int64)):
            print(f"Type in column '{item}' at index {i}: {current_type}")

Final cleaning
Before we are able to plot our data, I needed to modify county names in order to make sure the columns didn’t contain elements that could cause issues (dashes, commas). Following this, I created month, year, and monthyear columns for plotting purposes.
Conclusion
Starting from data gathering, we’ve followed every step required from cleaning to plotting. This is all I've planned to accomplish, the entire project also included moving averages for the unemployment rates and other interesting ways to analyze the data, but this is all I am willing to share for now.